import matplotlib.pyplot as plt # We import matplotlib to generate bar plotsA Report by …
Name: Kashish MukhejaIntroduction
This task aims to explore various aspects of data analysis and interpretation using Python, specifically focusing on basic data manipulation, calculation, visualization, and discussion of results. Through a series of questions and tasks, we will analyze a dataset containing information about friends and family, including their names, heights, and weights. We’ll perform calculations such as calculating BMI and New BMI, categorizing individuals based on BMI, generating visualizations like bar plots with color-coded bars representing BMI categories, and discussing the benefits, limitations, and potential misuses of BMI measures from both medical and societal perspectives. By completing these tasks, we aim to gain a deeper understanding of BMI analysis techniques, their implications, and their broader societal context.
Data Preparation
To start with, let’s import the necessary libraries and define three Python lists containing basic data on my friends/family.
# Basic data on friends/family
names = ["Rajesh", "Priya", "Amit", "Sneha", "Divya"]
heights = [165, 170, 175, 160, 168]  # in centimeters
weights = [70, 60, 80, 55, 65]  # in kilograms
This code snippet defines basic data about friends and family, including their names, heights (in centimeters), and weights (in kilograms). The names of individuals are stored in the list names, their corresponding heights are stored in the list heights, and their weights are stored in the list weights. Each list is structured such that the ith element corresponds to the respective data (name, height, or weight) of the ith person in the dataset.
BMI and New BMI Calculation and Analysis
We now move forward to leverage the parameters, weight and height for each individuals to calculate their Body Mass Index. I referred the below formulas based on https://en.wikipedia.org/wiki/Body_mass_index and https://en.wikipedia.org/wiki/Body_mass_index to calculate BMI respectively.
- Body Mass Index (BMI): The BMI is calculated using the following formula:
\[ \text{BMI} = \frac{\text{weight}}{\text{height}^2} \]
Where:- ( weight ) is the weight of the individual in kilograms.
- ( height ) is the height of the individual in meters.
- New BMI: The New BMI is calculated by taking the exponent of 2.5 of the BMI value. The formula is:
\[ \text{New BMI} = \frac{\text{weight}*1.3}{\text{height}^{2.5}} \]
These formulas are commonly used to assess an individual’s body composition and health status based on their weight and height measurements.
# Calculate BMI and New BMI for each person
bmis = []
new_bmis = []

for i in range(len(names)):
    height_meters = heights[i] / 100  # convert height to meters
    bmi = weights[i] / (height_meters ** 2)
    new_bmi = 1.3* weights[i] / (height_meters ** 2.5)

    bmis.append(bmi)
    new_bmis.append(new_bmi)

# Print BMI and New BMI values
for i in range(len(names)):
    print(f"{names[i]}'s BMI is: {bmis[i]:.2f}, New BMI is: {new_bmis[i]:.2f}")
Rajesh's BMI is: 25.71, New BMI is: 26.02
Priya's BMI is: 20.76, New BMI is: 20.70
Amit's BMI is: 26.12, New BMI is: 25.67
Sneha's BMI is: 21.48, New BMI is: 22.08
Divya's BMI is: 23.03, New BMI is: 23.10This code calculates the Body Mass Index (BMI) and the New BMI for each person in the dataset. It iterates over the list of names, heights, and weights, converting heights to meters and then computing BMI using the formula weight divided by height squared. The New BMI is calculated by taking the exponent of 2.5 of the BMI value. The resulting BMI and New BMI values are stored in separate lists (bmis and new_bmis). Finally, it prints out the BMI and New BMI values for each person in the dataset with their corresponding names.
BMI Categorization and Output
We now define the BMI categories that will help us to categorize the the above names as per the category underweight, normal, overweight and obese.
# Define BMI categories
def get_bmi_category(bmi):
    if bmi < 18.5:
        return "underweight"
    elif bmi < 25.0:
        return "normal"
    elif bmi < 30.0:
        return "overweight"
    else:
        return "obese"

# Print strings with BMI categories
for i in range(len(names)):
    bmi_category = get_bmi_category(bmis[i])
    print(f"{names[i]} has BMI of {bmis[i]:.2f} which is {bmi_category}. The new BMI index is {new_bmis[i]:.2f}.")
Rajesh has BMI of 25.71 which is overweight. The new BMI index is 26.02.
Priya has BMI of 20.76 which is normal. The new BMI index is 20.70.
Amit has BMI of 26.12 which is overweight. The new BMI index is 25.67.
Sneha has BMI of 21.48 which is normal. The new BMI index is 22.08.
Divya has BMI of 23.03 which is normal. The new BMI index is 23.10.The provided code defines a function get_bmi_category(bmi) that categorizes BMI values into different categories based on the World Health Organization (WHO) guidelines. It then iterates over a list of names, calculates the BMI category for each person using the get_bmi_category function, and prints out a string containing the person’s name, BMI, BMI category, and new BMI index. This allows for a convenient summary of each individual’s BMI status and new BMI index based on the provided categories.
BMI Category Visualization
Data is showcased in a better way and more understandable when represented in a form of visualisation. Hence, we write down a code to generate a bar plot representing the BMI values of individuals, with each bar color-coded according to their BMI category.
# Define colors for each BMI category
colors = {'underweight': 'blue', 'normal': 'green', 'overweight': 'orange', 'obese': 'red'}

# Create a figure and axis object
fig, ax = plt.subplots()

# Plot bars for each person
for i in range(len(names)):
    bmi_category = get_bmi_category(bmis[i])
    ax.bar(names[i], bmis[i], color=colors[bmi_category])

# Set labels and title
ax.set_xlabel('Names')
ax.set_ylabel('BMI')
ax.set_title('BMI Categories')

# Create a custom legend
handles = [plt.Rectangle((0,0),1,1, color=colors[label]) for label in colors]
labels = colors.keys()
ax.legend(handles, labels)

# Show plot
plt.xticks(rotation=45)
plt.tight_layout()
plt.show()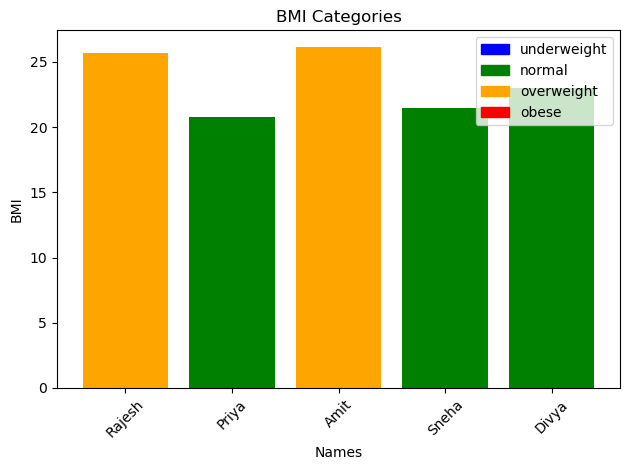
This above code generates a bar plot representing the BMI values of individuals, with each bar color-coded according to their BMI category. It creates a figure and axis object, plots bars for each person using their BMI values, sets labels and a title for the plot, generates a custom legend with color-coded labels for BMI categories, and finally displays the plot with rotated x-axis labels for better readability.
In the above exercise, we generated BMIs, New BMIS and categorised those BMIs for the list of 5 people. Let’s look at the Benefits, limitations and possible missuses of these metrics.
Benefits of BMI and New BMI: BMI and the New BMI offer a straightforward and easily calculable measure for healthcare professionals to assess weight-related health risks quickly. They serve as valuable initial screening tools, providing insights into potential health issues such as cardiovascular disease and mortality rates. Additionally, the New BMI, with its emphasis on visceral fat through a higher exponent, attempts to refine the assessment of health risks associated with excess adiposity.
Limitations of BMI and New BMI: However, both BMI and the New BMI have limitations that must be acknowledged. Firstly, they do not directly measure body fat percentage or distribution, which can result in misclassifications, especially for individuals with high muscle mass or dense bone structure. Additionally, BMI does not consider differences in body composition across various demographic groups, potentially leading to inaccuracies in assessing health risks.
Possible Misuses: Moreover, the emphasis on achieving specific BMI categories can contribute to body image issues and weight stigma within society. The cultural idealization of thinness may lead to unhealthy behaviors such as disordered eating and excessive exercise in pursuit of a lower BMI. Furthermore, relying solely on BMI as a measure of health may oversimplify complex health factors and perpetuate the misconception that thinness equates to healthiness.
Conclusion
In summary, this analysis provided valuable insights into the BMI distribution among friends and family, shedding light on their respective health statuses. By categorizing individuals into BMI categories and visualizing the data through a color-coded bar plot, we were able to identify trends and patterns that may inform future health interventions and lifestyle adjustments. However, it’s essential to acknowledge the limitations of BMI as a sole measure of health and to consider other factors such as body composition, diet, and physical activity levels when assessing overall well-being.
Possible extensions of this analysis could involve incorporating additional demographic information such as age, gender, and ethnicity to examine how these factors influence BMI distribution. Moreover, longitudinal studies could be conducted to track changes in BMI over time and assess the effectiveness of interventions aimed at improving health outcomes. Furthermore, exploring the relationship between BMI and other health indicators such as blood pressure, cholesterol levels, and chronic disease prevalence could provide a more comprehensive understanding of individuals’ health status. Overall, this analysis serves as a starting point for further research into understanding and promoting optimal health and well-being within communities.